
Unique Similarity-Based Machine Learning Applications
simMachines revolutionizes what’s possible for today’s marketing, fraud and compliance professionals. Enabled by “the Why” factors revealed behind every prediction, we provide rich machine driven insights at the speed and scale of today’s fast moving world.

Predictions with the Why
Other machine learning methods provide a prediction – simMachines provides much more. With every machine learning prediction, our technology reveals the justification for the prediction – or “the Why” – providing insights into what factors are driving the prediction, listed in weighted factor sequence. The nearest neighbors for that prediction are also provided by distance, with keys that tie back to each nearest neighbor object in your database.
simMachines can also provide “the Why” behind other algorithms, using that algorithm’s prediction as an input to our engines, and mirroring the other algorithm to produce “the Why”.
Functionality Summary
- Justification: View the weighted factors behind each prediction to understand a prediction’s primary causes
- Hypothesis: Compare the gravity of a prediction’s unique factors to its opposite class to visually see its unique differentiators
- Nearest Neighbors: You can choose any of the similar objects that the engine found to analyze them individually against each query in more detail.
- Selection & Output: A restful API call is available for automating export of a prediction with or without its associated data to other systems.
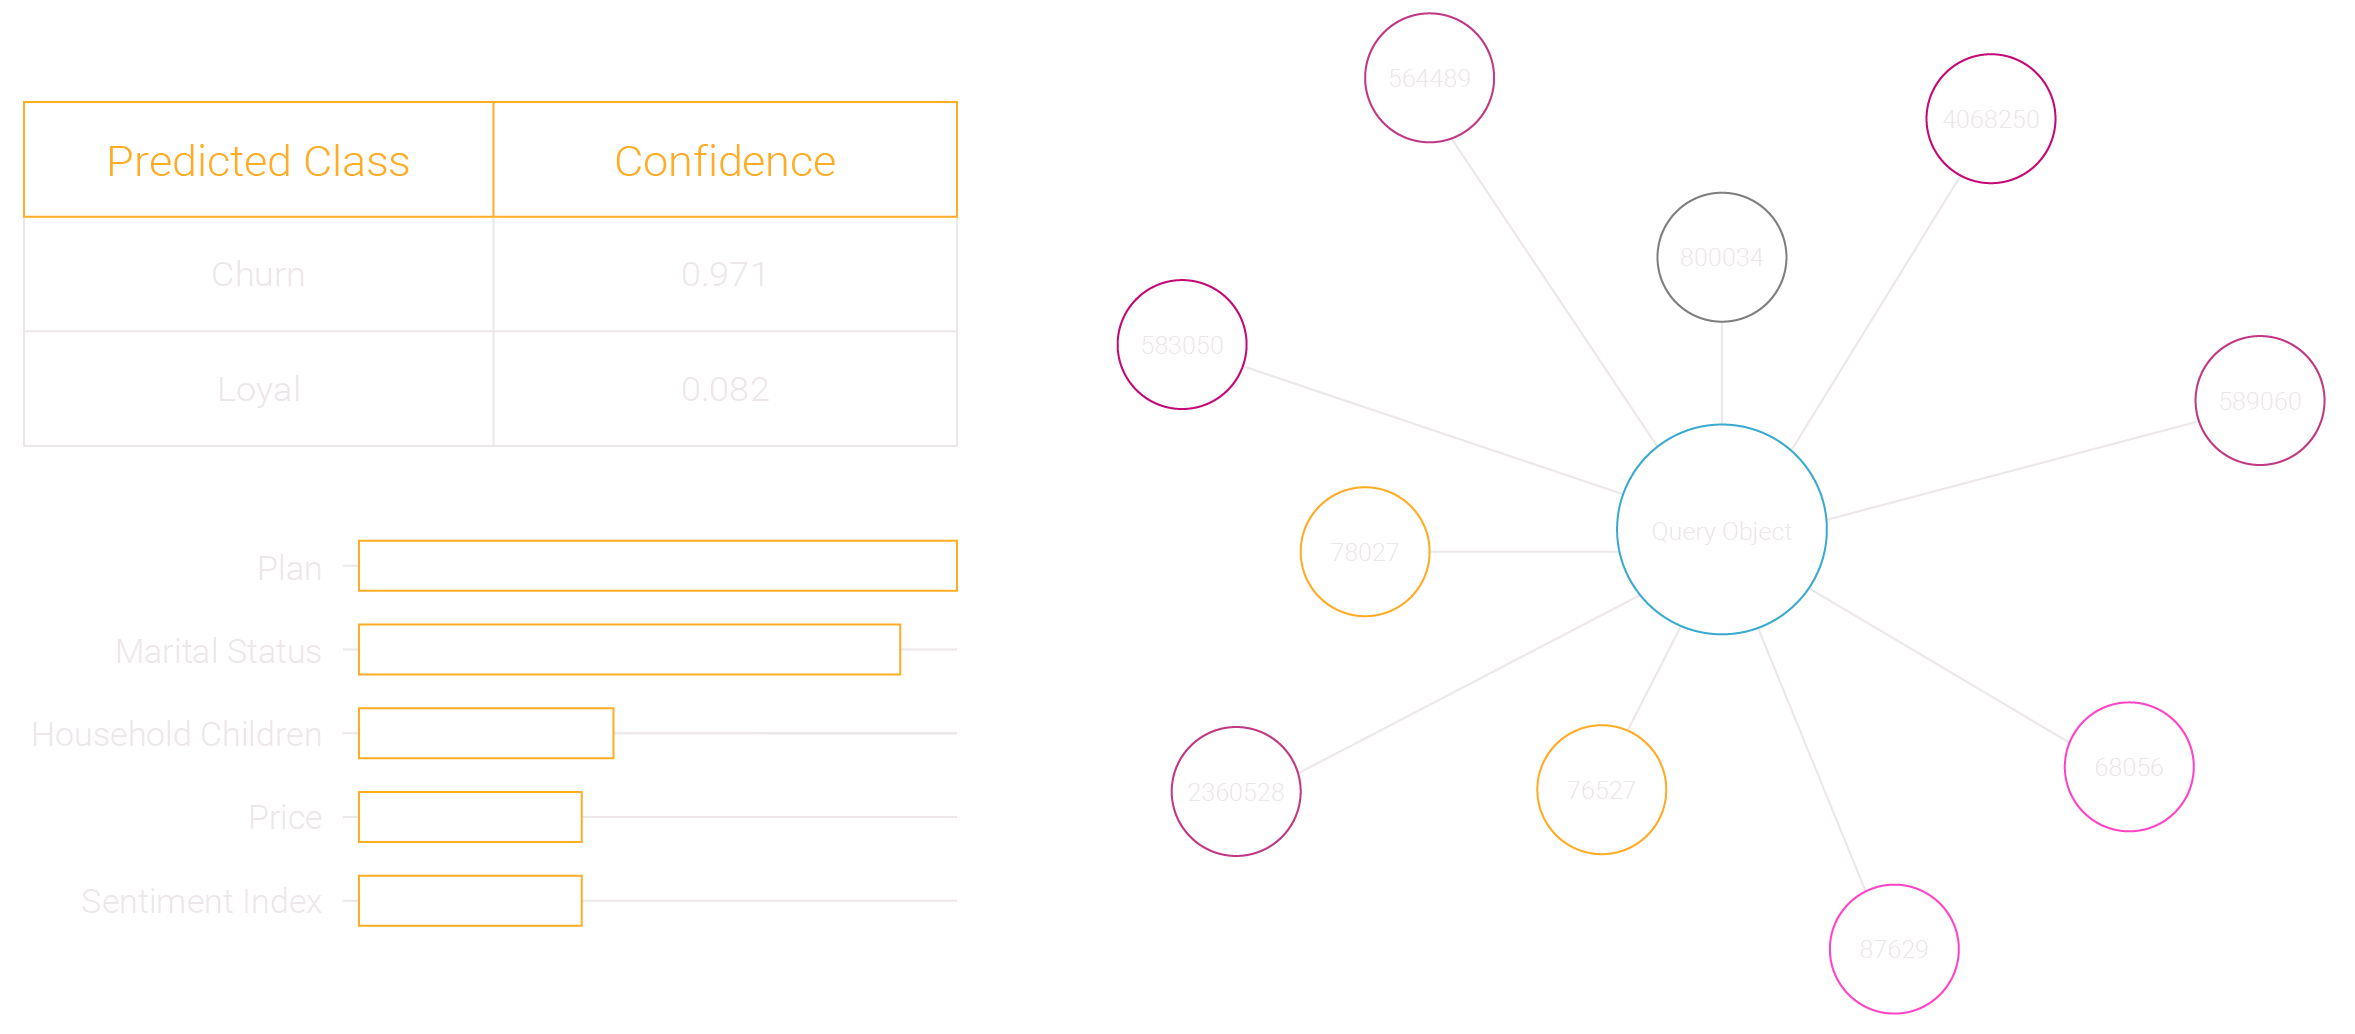
simMachines provides full transparency behind every prediction it makes. This enables business owners to understand what the machine based its predictions on at a local prediction level.
I now know the root cause of the this prediction
I can see the detailed factors in weighted order
Now I can take an informed action with confidence
Traditional Machine Learning’s Limitations: Every machine learning algorithm will generate a prediction like the one in the example above. Machine learning’s “black box” problem is that a prediction is made, but the business user doesn’t know why.
What is the root cause of this prediction?
What are the factors associated with this prediction?
Can I use this prediction to make an informed action?

Our similarity machine learning method enables us to generate dynamic predictive segments by grouping similar predictions together. These innately contain highly actionable insights at a segment level. Granularity can be defined by the user, and full transparency enables users to see the machine-driven factors behind each segment, compare segments, trend segments over time, and forecast the future behavior of a segment.
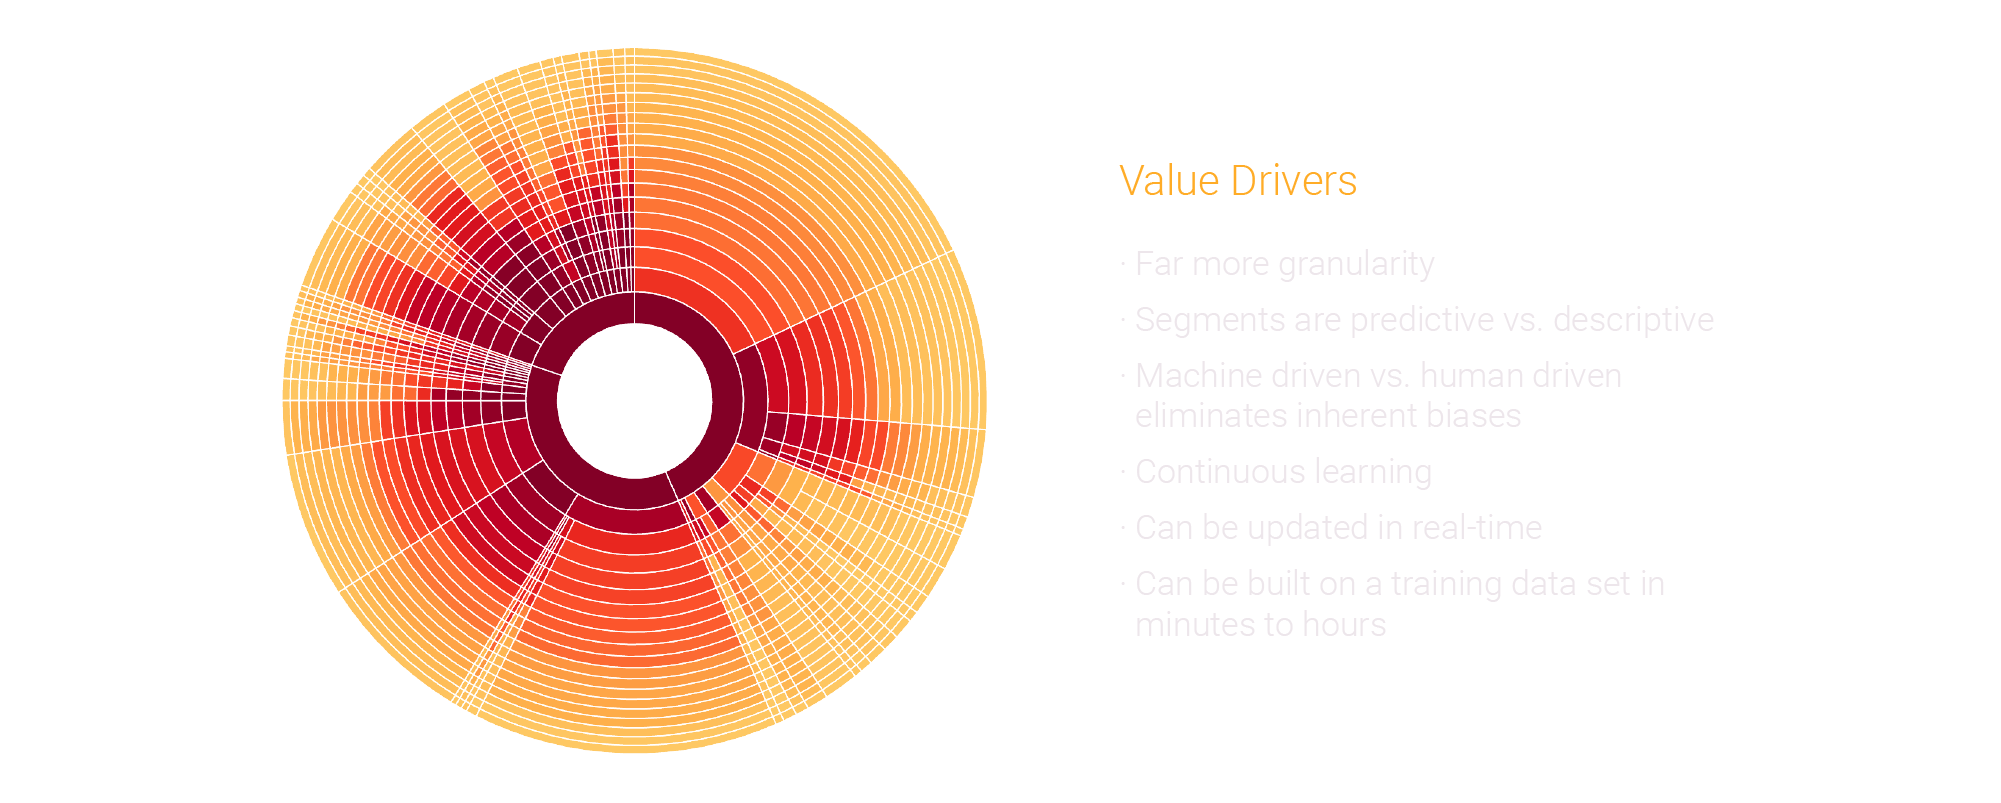
simMachines uses its own similarity machine learning clustering engine to group predictions together. Clients can create clusters for different purposes as needed, query across clusters, and compare clusters and segments together over time.
Functionality Summary
- Cluster Creation: Create as many clusters as you like and define any number of classes for each cluster for analysis or campaign planning purposes
- Cluster Visualization: View the total number of segments tied to each class and see where each segment becomes distinctive from another at any level of granularity desired
- Segment Telescoping: Drill in on any segment to view its similar weighted factors and shift the order of weighted factors if needed
- Segment Labeling: Label segments to fit your objectives based on its defining factors
- Difference Comparison: Compare two segments together to see their differences
- Selection & Ouput: Highlight the selection factors you want to leverage in selecting an audience segment and output the objects with or without their associated data. A restful API can be used for automating selection output.
“100% of firms agree not adopting dynamic predictive segmentation is risky.”
Capture The Customer Moment With Dynamic Predictive Segmentation, a January 2018 commissioned study conducted by Forrester Consulting on behalf of simMachines

Customer Experience Optimization
In today’s highly demanding one-to-moment consumer landscape, the competitive battle field is based on how well you can manage each customer’s experience. Dynamic predictive segments can be leveraged to inform every customer interaction, with great precision and speed.

Functionality Summary
With Dynamic Predictive Segmentation for customer experience optimization you are able to:
- Create Multiple Clusters – Generate clusters that predict the likelihood a customer will buy a particular product or combination of specific products. Clusters can be generated in several hours and then updated and queried in real time.
- Query – Query a record in a cluster and immediately see which segment it falls into to tailor your marketing message and offer.
- Multiple Queries – Query a record across multiple clusters to determine what is the best recommended action to take during an interaction.
- Dynamic Recommendations – Dynamically adjusted recommendations during a customer interaction adjust throughout the interaction to make the most relevant offer.

Explainable Pattern Detection & Forecasting
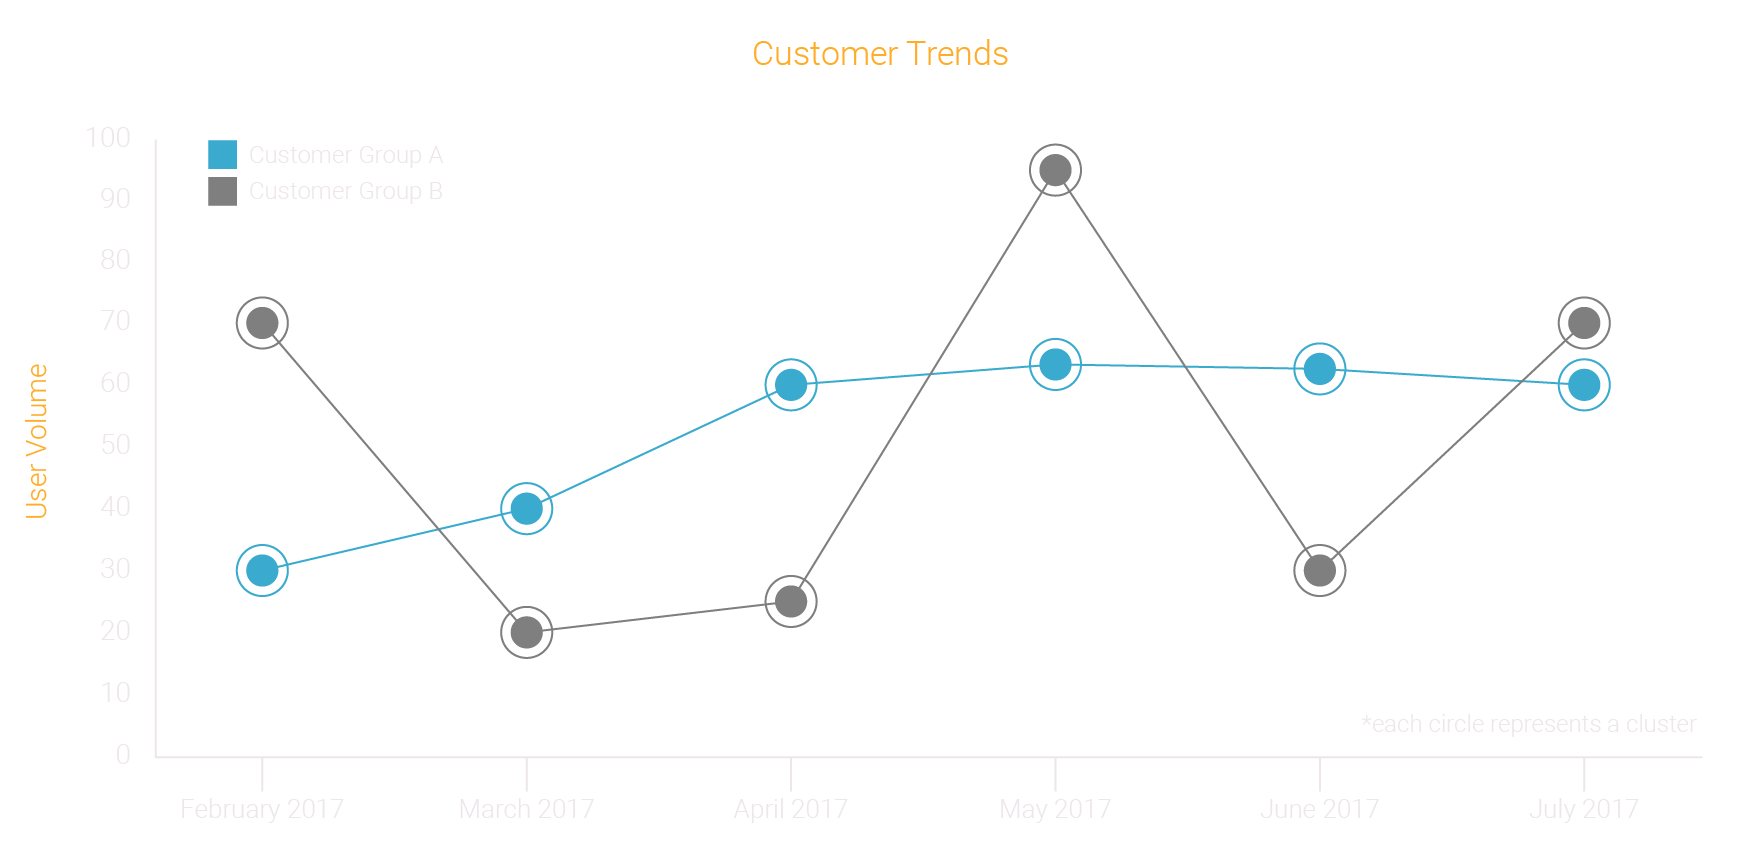
Explainable pattern detection and forecasting is essential to today’s businesses. Especially when using machine learning to consider all data sets that affect consumer behavior. simMachines enables businesses to detect emerging patterns, forecast future demand or consumption, and view historical trends in granular depth.
In this example, a large retailer wanted to trend users of VR equipment over time, for retention analysis and to forecast future device usage, as well as compare the user segments of one device to another.
Functionality Summary
- Time Series Comparison: Compare two clusters, segments or classes over time
- Trending: Create time series analysis of the historical data by time stamping specific snapshots at any interval for reporting and analysis
- Pattern Detection: Reveal patterns in the data using “the Why” factors to explain the drivers of shifts and changes over time
- Anomalous Pattern Detection: Isolate non-similar objects as they occur based on distance parameters for analysis and reveal emerging patterns as these non-similar objects begin to appear more than once
- Forecasting: Build forecasts of predicted future events based on any time horizon or criteria and reveal the drivers of forecasts based on the weighted why factors

Audience Centric A/B Measurement
A/B testing and measurement has historically relied on a creative vs. audience centric approach for evaluating performance. simMachines technology goes beyond traditional approaches to provide highly precise measurement of positive vs. negative ad effect, at a one-to-one audience level, and exposes the most important behavioral drivers of buyer behavior.
Through an automated process, “Beyond A/B” enables a user to quickly run through the full process in hours. Inputs include test and control groups, a master footprint file and conversion / response data. A restful API is available and the application can run on premise or in a private cloud.

Functionality Summary
- Twin Pairing: between test and control, with controls for match accuracy and statistical tests based on all applicable data columns in your master data set
- Manage Drop Outs: drop unexposed individuals from test and equally, their control twin, automatically
- Feature Weighting: Control the weight of specific columns in your data if necessary as part of the matching process
- Bias Testing: Evaluate match precision through bias testing and make adjustments on the fly
- Ad Effect Analysis: Reveal one to one positive vs. negative ad effect, and degree of effect, by individual. Analyze ad effect clusters with common weighted feature sets with interactive visualizations to understand drivers of positive vs. negative ad effect including multi-variate analysis
- Frequency Reporting: Ad frequency by machine driven audience segment of positive ad responders can be provided if ad impression data is made available
- Look-A-Like Audiences: Generate similar positive ad effect audiences immediately in rank order
- BI Tool Export: Export all data to BI tools like Tableau or Click View for campaign reports