
Demand Prediction & Forecasting Software
In this demo, we are illustrating our demand forecasting software’s ability to sift through historical data and make predictions on what type of services or products, people belonging to each neighborhood, will be demanding/requiring in the upcoming days. Upon arriving at this info, we categorize these products/services according to different categories and eventually derive the number of control payments that will be made to/by a bank. This prediction is segmented according to neighbourhood, age group and which day of the month. The dataset used for this demo and other reference links are mentioned within the demo page itself. Please visit the link mentioned at the bottom of the page to access the demo.
Instructions:
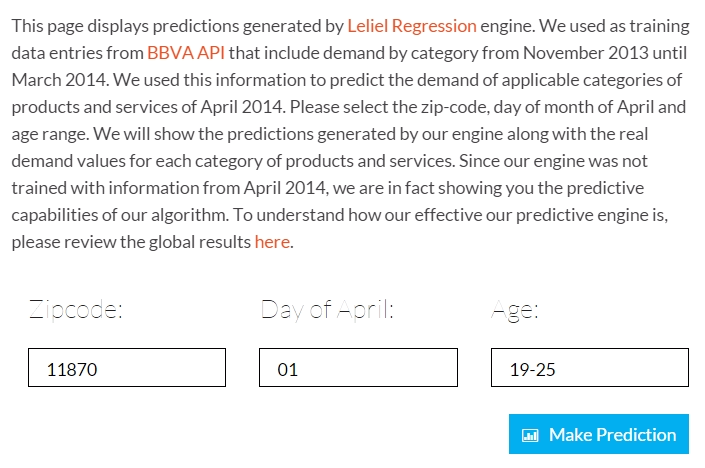
Please select the zip code of the location you are interested in, the day of the month in which you want to see the prediction and the target age group whom you are willing to observe. Following which, click on the “Make Prediction” Button.
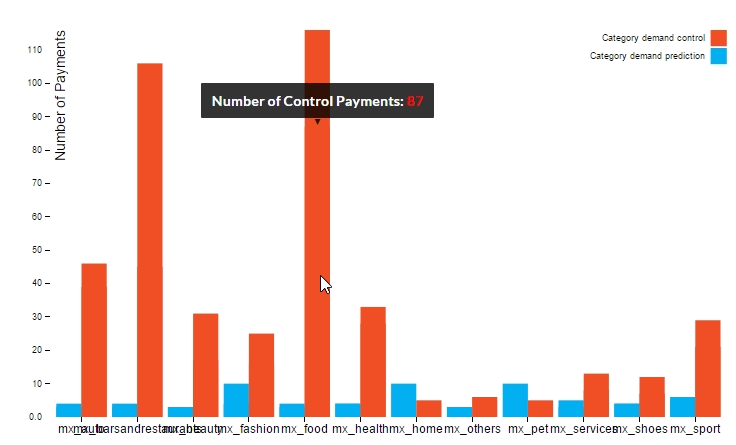
A bar graph will be displayed, detailing the different categories and its associated number of payments, as shown in the image below.
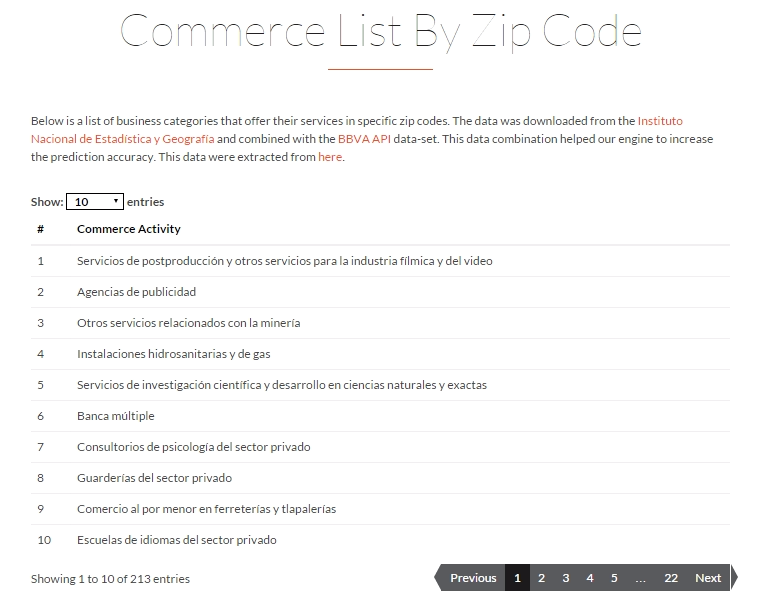
At simMachines, we not only provide predictions, but also the justification/reasoning behind the predictions. Scrolling down from the bar graph will explain our justification for the predictions made above by displaying the list of commerce activities offered in each neighbourhood and how it is related to the predictions made.
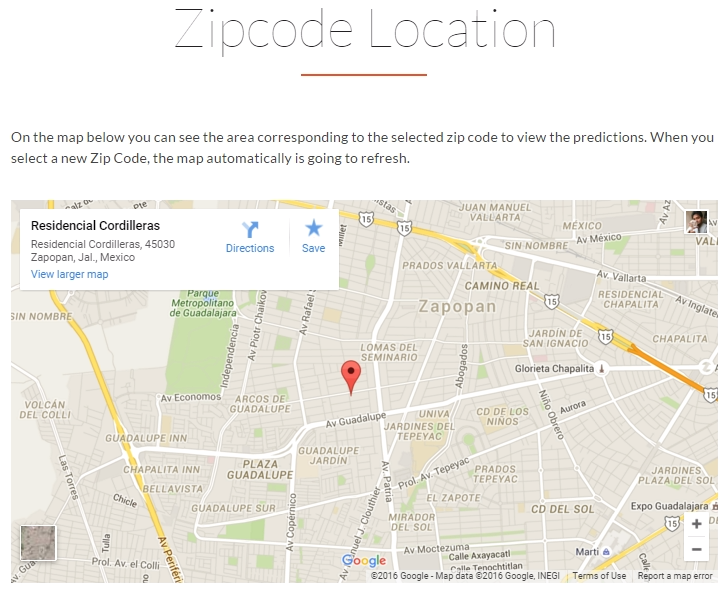
Finally, a map would also display the selected neighbourhood, thus giving a visual impression of the selected zipcode.
For more information on our demand forecasting software, contact us!